
The old version of Google Analytics will stop collecting data on July 1st, 2023. Unfortunately, there is no way to migrate past data into the new version of Google Analytics (GA). Plus, the new GA has a steep learning curve.
Many of our clients are switching to Plausible Analytics, which does allow you to import your old GA data, is easier to use, and respects users’ privacy.
On June 14th, 2023 we hosted a webinar to talk about the pros and cons of switching to Plausible, demo the tool, and answer any questions people had.
View the Plausible Analytics for Nonprofit Websites Slides
What is Plausible Analytics?
Plausible Analytics tracks common site traffic information for a website, including pageviews, bounce rate, traffic sources and search terms. It’s similar to Google Analytics, except that it’s more privacy-friendly (including GDPR compliant) and easier to use.
Plausible Analytics Advantages Over Google Analytics
| Google Analytics | Plausible Analytics |
|---|---|
Cannot migrate Universal Analytics data to Google Analytics 4
| Can migrate Universal Analytics data to Plausible |
| Designed for large enterprise sites (steep learning curve) | Designed for small to medium-sized orgs |
| Not GDPR-compliant (requires a cookie consent banner) | GDPR-compliant and privacy respecting (no cookie consent banner needed)
|
| Proprietary software, big tech | Open-source software, small business |
| No in-person support 😂😭 | In-person support |
| Requires Google user accounts for access | Easier to provide team access via a shared email address and login, or in-site dash via the Drupal module and WordPress plugin |
Google Analytics Advantages over Plausible Analytics
| Google Analytics | Plausible Analytics |
|---|---|
Can track data across apps and web properties within one dashboard
| Cannot track data across apps and web properties within the same dashboard |
| Integrates well with Google’s ad services | Can create goals for Google ad campaigns |
| “Free” to use | Pay based on site traffic (see Pricing page for details) |
Plausible Analytics for Nonprofit Websites Transcript
Clayton: Welcome to the Plausible Analytics for Nonprofits webinar. So what is Plausible Analytics? It is an easy to use and privacy friendly Google Analytics alternative.
Here’s a screenshot of the dashboard that you see to kind of give a sense of what kind of analytics are being pulled in and and what it looks like, but we’ll also do a live demo just to get really into the specifics.
Advantages of Plausible
Some advantages of Plausible. I mean a really really big one is that the old Google Analytics, which is called Universal Analytics, you cannot migrate that data to the new Google Analytics 4 platform. It’s such a significant rewrite and it’s significant like difference in interpreting site traffic and metrics that it’s just not an apples to apples understanding of site visitors and behaviors, whereas Plausible Analytics does still have a very similar framework for how page views are counted how site traffic is measured and so you can migrate your old Google Analytics data into Plausible. There is a little bit of limitation with filtering and whatnot with that old migrated data, but it’s still available in a lot of ways and we’ll get into some of those specifics in the demo as well.
Another thing is that the new Google Analytics platform is really designed for large enterprise sites that are doing a lot of e-commerce work and we’ve found it to be a pretty steep learning curve. I mean all of this is somewhat subjective, you know some people are able to wrap their heads around it pretty quickly, but yeah in general we’re finding people to really struggle with it and honestly a lot of people were already struggling with Google Analytics the old version. It’s an even steeper learning curve from our vantage point, whereas Plausible Analytics is designed more for small to medium-sized organizations. So it’s easier to learn, it’s more intuitive from the get-go.
The other thing is that GDPR is the European Union’s big data privacy law. It’s what prompted people to update their privacy policies, for people to start using cookie consent banners, make it easier to delete data that’s being collected about users and it’s honestly one of the big reasons that there is this new redone version of Google analytics. This Google Analytics 4 was an attempt to become compliant because right now Google Analytics is not. It’s straight up illegal to use Google Analytics in Europe and that’s been decided in several different courts in France in Australia, errrr not Australia, Austria, and somewhere else I think the Netherlands. It’s still actually not legal, even the new Google Analytics 4 is still not GDPR compliant because as long as Google’s running their servers in the United States and processing data here in the US because our privacy laws are so terrible it’s going to continue to be illegal. Right now it’s in the courts and Google is fighting that decision this year. European courts might favor Google and the new Google Analytics but as of today it’s still not GDPR compliant.
I think everyone on this call in practical terms, sure you are technically supposed to follow GDPR laws even if there’s a single visitor from Europe to your site, but in practice in reality they’re not going to be going after U.S based especially small non-profits who are good people. They’re going after the shady corporations that are sucking up people’s data and using it unethically. So on a practical level I don’t think that anyone really needs to worry about that. You can use the new Google Analytics platform and you’re not going to get a knock at the door for violating people’s privacy, but to that second to last bullet point, you know it is still proprietary software that is coming from Big Tech, that’s coming from Google. They’ve had lawsuit after lawsuit at this point violating people’s rights.
So Plausible is a really great more ethical alternative in that regard and if you’ve ever tried to get some assistance with some kind of question you have with any sort of Google service you know there’s no in-person support so you’re really just at the mercy of help documents and web forums and other people who are using Google products and whereas Plausible is a team that is very responsive. So there’s that advantage too.
Then it’s really easy to provide team access to other people with a shared email address and login. You’re not beholden to Google’s account management system.
Google Analytics Advantages
There are some advantages that Google Analytics still has over Plausible. A big one is and this was a big selling point with the new version of Google Analytics, Google Analytics 4, which is that if you have an app and a website and you want some kind of relationship between the two or if you have two different websites or more than two and you want to be able to see that data tracked holistically. For example, if I was to visit one of your sites and then from there I’m directed to another sister site or sibling site you can configure Google Analytics to track that in a single session and see that behavior between web properties or apps in a single dashboard.
In Plausible you can set up Plausible Analytics on every single one of your websites but, as soon as I leave Website A and go to Website B that data is now in two different dashboards, one for my activity on Website A and one for my activity on Website B. It also doesn’t work for apps if you have some kind of app, you can’t install Plausible Analytics and track it that way.
The other advantage is you know because it’s a Google product it integrates well with Google Ad services so if you run Google Ad campaigns, it’s gonna be pretty easy to generate reports showing like you know I ran this specific ad campaign and like this percentage of people donated on the site. You can still create goals for things like Google Ad campaigns for things like newsletter traffic in Plausible Analytics. So some of that is still possible, it’s just not going to be quite as robust as Google Analytics.
Then another advantage of Googling Analytics is it’s quote unquote free to use. You’re not paying anything monetarily to Google, you’re paying with your data that they you know they do anonymize, but they’re taking that and using it you know to maintain their hegemony in the in the world. With Plausible you do have to pay. I’ll get to the pricing pretty soon, so it starts at nine dollars a month and it’s based on your site traffic so in terms of pricing you can have up to 50 websites under one account. If you do have multiple websites then it’s just a single account that you’re paying for and then that price is based on your total monthly page views. So that’s in aggregate so if you have three websites and one’s getting a thousand page views a month and another’s getting 20,000 page views a month then you’re at 21,000 page views. So you would be at that first tier 10K, 10,000 page views it’s you’re starting at nine dollars a month or $90 for the year.
As soon as you go from 99,000 page views a month up to a hundred thousand or more then you’re at that $19 a month tier and up and onward into higher and higher traffic.
One thing that’s nice that kind of goes back to this is a good, reputable ethical company is that you’re not seeing this stark price jump from you 10K to 100K that you see with a lot of platforms where they really punish you for success and growth. So that’s really nice. It’s very predictable, so you can budget accordingly.
Installing Plausible Analytics
As far as what’s involved with getting it set up, your team would create the account, you would invite DevCollab as admins and then we would install the actual Plausible software onto your website. There’s a Drupal module and there’s a WordPress plugin. Neither of them have license fees, it’s pretty quick to install and configure and in part that’s thanks to Steven who’s on this call, so shout out to Steven. He has added a feature to the Drupal module that will create a reporting page within your website that shows your Plausible analytics there for anyone, well you can configure it for what roles can see that page, but it’s only visible to someone logged into the website and has the proper permissions to see that dashboard, which is is really cool.
If you have Google Analytics running, which I think all of you on this call do, the old Google Analytics, we would migrate that Google Analytics data. It’s honestly a pretty seamless thing, it’s a matter of making sure we have admin access to your Google Analytics data and then it’s a literal click of a button to import that.
We can also connect it with, if you have a Google Search Console account, we can connect that too. That’s also pretty simple as long as we are added to your Google Search Console account. Again it’s a click of a button to get that up. So we can get you up and running really within a week for sure, oftentimes within a day. If we have enough time and I’ll talk more about like what what I mean by Google Search Console, so I’m gonna jump into the live demo and again if you have questions that come up along the way from all of this drop them in the chat and we will answer them at the end with the Q and A portion.
So the first thing is I wanted to just show a screenshot of the Google Search Console integration because I didn’t want to get too far into any of your dashboards so this is a screenshot from the Center for Land Use Interpretation. They were generous enough to share a snapshot of their data and so you can see, if you’ve got Google Search Console set up, this integration will then show the search terms that people are searching to bring you to their site. So most people are searching for this big 10 curve a lot of people are searching for the name of the organization, etc.
Live Demo
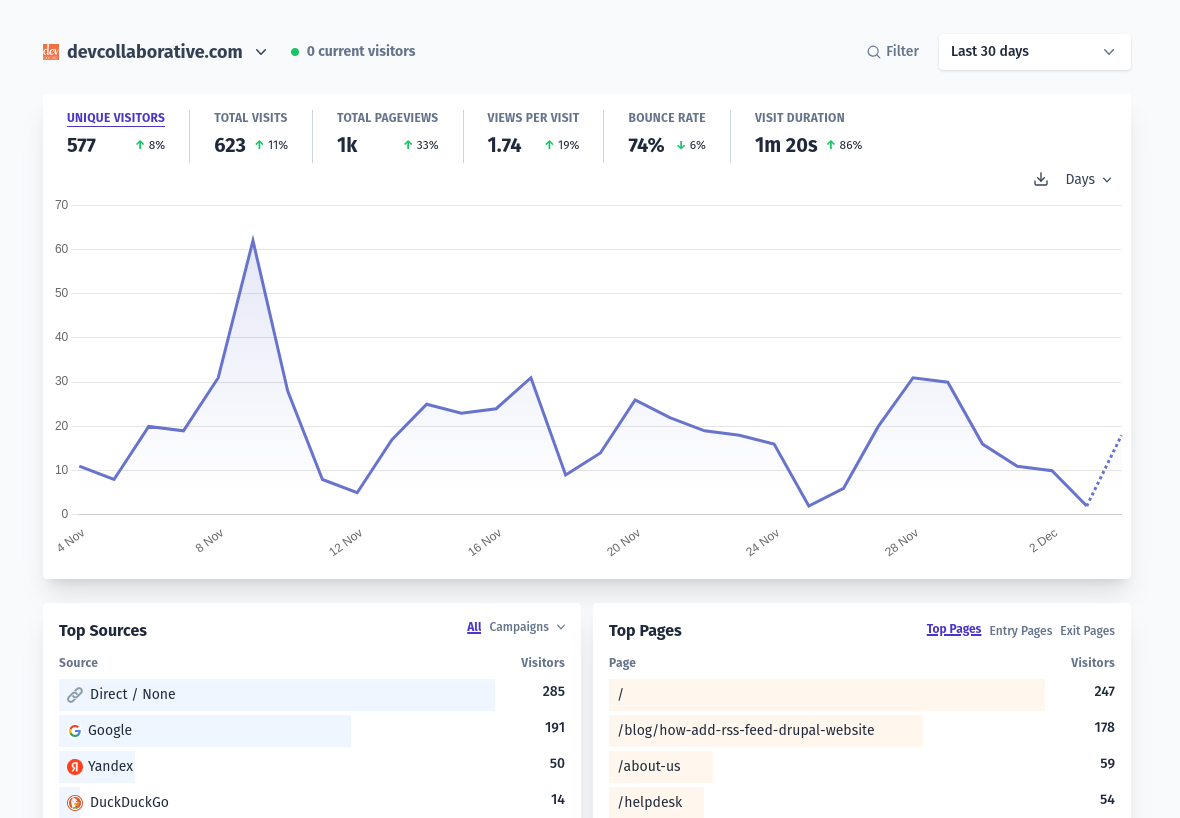
I’ll leave this and come over to the dashboard and so here is our dashboard for our devcollaborative.com website and right now by default is showing month to date.
We’re just halfway through the month of June so that’s where we’re at and you can see right now it’s displaying this data by each day so you can see the kind of and down of the site traffic. You can see, you know not to brag too much, but this blog post I wrote about how to set up an RSS feed on a Drupal site is the top page earner.
As you can see, lots of fellow Drupal nerds come into our site from drupal.org or Google. We don’t have Google search Console setup entirely so we can’t see those search terms but my guess is it would it, yeah something for us to do. This is our own website. The cobbler’s children and their poor shoes. We need to get that set up for ourselves.
Some people are coming from DuckDuckGo, Yandex is another search engine and let me just kind of filter by a little bit more so let’s do the last 30 days. So this is a week view and again here’s the day view and you can see these numbers all update based on whatever filters I have set up. If I was you know you can do a custom range so if I come back maybe from April on to May then here’s the site traffic here. You can see here again are the top pages. My blog post is still winning and you can also see where people are coming from in the world, device, desktop versus mobile browser, operating system.
If I was like okay I just want to see everything that is blog related, then I can come in here and filter by page and actually this is nice. So what you can do is include or exclude specific pages, you can also do contains. So like I’ll do that for this. So I want anything that contains a blog in it and apply that filter and now we’re just seeing the blog listing page and then all of our specific blog posts and we can then see the traffic and also the most popular blog posts and if I click into details and I see the full list here.
So that’s filtering.
The other thing, so again thanks to Steven you can have this dashboard directly in your website and that’s true for both WordPress sites and Drupal sites. This is great because one of the most common challenges that we hear from you all is how can we be better about just just even bringing analytics more into a regular workflow? For a lot of people it’s set it and forget it when it comes to analytics. Even just having it in the website and not having to mess around and make sure someone has the right permissions to be in your Google Analytics account and remember to go to https://analytics.google.com to look at things, that’s that’s an advantage there. It’s just right there in your website.
Another thing that I really love about Plausible is you can configure it to send out email reports and I’ll share that configuration page. So here you can choose if you get a weekly email report, you can choose who receives that email report. There’s also monthly. Then this one is really cool. You can get traffic spike notifications. If I write a blog post about some kind of esoteric Drupal topic that just really gets people excited then our site might end up getting a bunch of visitors and and reading that and we’ll get an email then knowing that. That’s really great because then you can be a little bit more proactive, maybe a new report is published on your site and it’s getting a lot of traction and then you would get proactively emailed about it. It’s so great. So that’s that feature.
Then I’ll end with the thing that is again I think one of the most limiting things, which is kind of frustrating and I want to reach out to the Plausible team and see if they have this on their roadmap because the reporting. So you can take a screenshot of this entire page and share a report that way, but as far as sharing a report with data that you can manipulate and work with the the only thing that it does is you can click this download button and then if you see in my bottom screen it creates a zip of all of these different CSV files. I’ll share a screenshot of what that looks like so you really you just get a a very straightforward plain CSV file. To their credit there’s a lot of different kind of slices of that data that you get. This is just one example, here’s visitors and page views for May 8th, 9th and 10th all the way up to whatever date range I had set my filter to. I think that idea is that it’s in this CSV format, you can then spruce up that spreadsheet however you see fit. You have the data so you can generate charts and whatnot, but it’s you’re not getting a nice PDF version of this. Google Analytics does that. That’s one limitation I’d say is the reporting. There it is a little bit less robust, but again because it’s so easy to share you can get your teammates into the direct dashboard and have them look at this themselves.
Questions and Answers
That I believe covers the demo in the presentation. I can pause and take a breath and just answer any questions. Happy to dive into at least our dashboard, happy to share any other aspects of this with people.
Johanna, do you want to yeah let me know.
Johanna: Well first of all thank you everyone so much for coming. We’ve got 16 folks on here who are not us. That is great. I love seeing people who are interested in not Big Tech. We have a bunch of questions so we can go through them one by one and then we can also just drift into discussion and other questions as needed. You can feel free to keep using the chat so I’m just gonna start with the first question from Amy. Feel free to turn your video on or keep it off or whatever but pipe up if you want to clarify your question or expand on it.
She has a quick pricing question.
Does the monthly fee automatically adjust depending on the number of page views per month or do you have to pay a yearly subscription up front?
Clayton: Yeah, you can choose whether to pay on a monthly basis or upfront for the year. I don’t know, That’s a good question as far as, I don’t know if you pay for the year at a certain level and then it goes up to a different level how they handle that. So I think that’s something that we could follow up and do a little research and email out the participants with that. We haven’t had anybody at those thresholds. They are pretty wide. We haven’t had anybody hovering between one or the other or that trips them into that next tier. Yeah, I mean we can we can ask Plausible questions if we can’t answer them and when we share back this recording we can send information as we get it.
Johanna: Then Amy’s other question is,
With the current version of Analytics you can identify traffic sources for a given piece of content can you see this info with Plausible?
Clayton: Yes you can. If you click into a specific page then those sources update for that specific page. You can see the About Us page, there’s a few more people coming from the Design for Drupal conference event because we’re sponsoring it so they probably are like oh what’s DevCollaborative all about? And came to us that way.
Johanna: Amy does that cover your questions?
Amy: Yeah that’s perfect, thank you so much.
Johanna: Sure, sure. So next up is Olivia. Olivia is asking,
How does Plausible handle integrations for automation? It looks like it is not a connected site in Zapier, which we use. Do you have recommendations?
Johanna: Steven just saw your question and already started researching that. Steven do you want to share what you found?
Olivia: Yeah I found, so because Plausible is open source on their GitHub page there’s a request from somebody to add Zapier integration. It’s from 2020 and it doesn’t seem like there’s much movement on it, but that is a request that is in. We’ll see. Maybe they’ll add that at some point but it doesn’t look like they currently have that, but there are other people who would like that too so maybe they’ll land that in the future. That was all I was able to find in the past like five minutes .
Clayton: Yeah, Zapier is super cool. I’m curious what are some specific kind of conditions that you would want to set up?
Johanna: Yeah go ahead Olivia.
Olivia: So one of the things we currently do is we use it with the RSS feed to track pages that we’ve published and we’re interested in hits on the page in a particular period of time. So right like one of the things that we do with Google Data Studio or Google Studio whenever they rebranded, is like merge those together and it allows us to look by quarter that we’ve published and I’m sure there’s a way to work around it probably with just the information here and not using the Zapier integration, I just would have to think it through differently than how it’s currently set up.
Johanna: The other thing I’m just going to suggest that we can do is we can see if because that’s a really specific question, Clayton maybe we can also get a contact person for you to ask specifically because it’s worth asking just because with the open source product you never know what is going on that you’re not necessarily finding, so I don’t know did you have any other thoughts?
Clayton: I have a tangential thought, which is that we haven’t set this up for our own site but you can set up specific goals, so like downloads of PDF files, thus hitting the submit button, a donation form, just visiting a certain page. So yeah, didn’t touch on that on the live demo, I just wanted to bring that up.
Johanna: Olivia I wonder if that might actually help you. We can follow up with you on that as well to see if that might help with your use case.
Olivia: Thanks.
Johanna: Our next question is from Miriam. Hi Miriam.
Can Plausible track PDF downloads?
Clayton: Yes, yeah that’s what that goals piece I just mentioned was.
Johanna: The other question was, is there anything that would stop us from having both Google Analytics and Plausible running on the site so if we try Plausible and decide it’s not robust enough we would still have the GA analytics from that time period?
I think personally that’s a fantastic idea. Yeah we have a few clients doing that. Yeah I think we’re doing that too on our extremely high traffic website.
I think you get a free trial with Plausible.
Clayton: That’s from when you create your account. Also Dee and I found a hack if you want to really go on the cheap you can pay monthly and then not pay and then your dashboard ends up frozen but the JavaScript is still running on the site so then you can go a couple months without looking at your analytics and then just pay for the next month and then unlock your dashboard and get all your data again.
Johanna: But we want to support alternatives to Big Tech.
Oh yes, so you can avoid doing that, thanks Clayton, to avoid paying nine dollars.
Johanna: Miriam did that address all your questions?
Miriam: Yeah that was helpful, thank you.
Johanna: Olivia one of the finest students in the land has another question,
If GA4 prevents you from migrating because the data is captured so differently, how does migrating work with Plausible?
Is it that Plausible captures data more similarly to UA? If not, how does that not lead to errors?
Clayton: Great question. Yeah that’s right. In a nutshell, the differences between Google Analytics 4 and Universal Analytics definitely starts getting outside my wheelhouse as far as the technical understanding goes. I definitely read a blog post about it and understood 60 percent of what was being thrown at me with the technical jargon. There’s a lot of analytics tools out there things like page views and bounce rate is a very universally held way of measuring things so there’s always going to be a little bit of discrepancy between those tools as far as how they’re detecting or not detecting bot traffic.
It starts getting into the… Johanna and Steven feel free to chime in if you want to add any more technical specifics, but yeah I think the overall message…
Johanna: so I don’t know. I think part of your question Olivia is, what if you are using GA4 or you want to switch back into GA4 can you port the data into GA4? That is a very good question.
Steven: The answer to that is no. That’s the real main takeaway that we’ve seen and a number of clients have seen from GA4 is one, it’s really hard to use. The interface is very complex and you’re starting from a clean slate. Once you turn it on and you start collecting data that’s it. There’s no way to import. There’s no way to start from your old data. You’re just starting fresh so that’s why you’ve been getting a lot of emails when you log into your Google Analytics you get this countdown thing. They’re really trying to urge you to move early to get some data in there early on, so when the switch happens which is next month, you know you’re not just starting from that clean slate. When the switch happens right away you have some historical data.
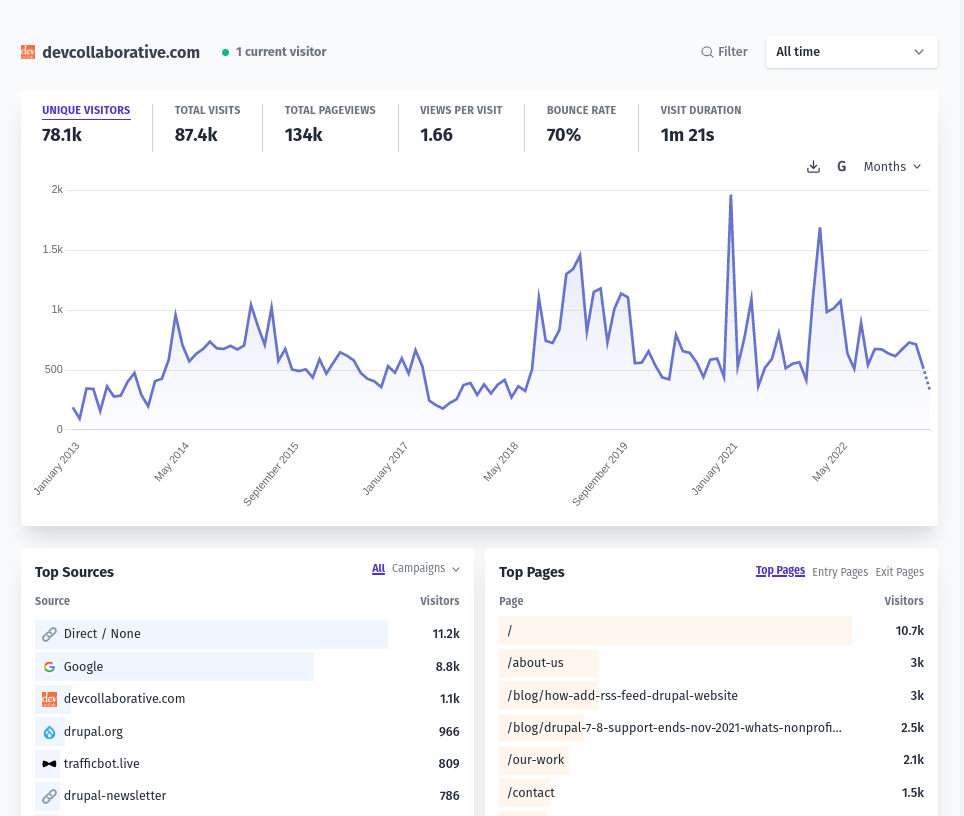
Clayton: I’ll say in summary, here is a look at our entire site traffic, everything up until recently. We should go back and check. Most of what you’re seeing here is from Google Analytics. What I’ve found is that it’s comparable. If I was to look at the visitor count here and go back to the old Google Analytics it’s in the same range. The numbers might be a little bit rounded.
Johanna: I would just say that this is a very Faustian bargain situation with a very particular set of trade-offs, this jumping off point from Google Analytics if you choose to get off it. They’ve made it more proprietary and it’s going to be a whole learning curve to be able to interpret it, but it’s even going to be a learning curve to build reporting that is useful to you and the old Google Analytics is based on more standard web, since the dawn of the web, sets of things that are measured and there are common things like bounce rate and page views and visits and all those things that we’re all familiar with. As somebody who was a staff person in a non-profit, a lot of times you’re thinking wow I have to report back on a program or to a funder about this is one of my data sources.
If you don’t need all the sophisticated features of GA4 this is gonna work and you’re not gonna have to onboard and be trapped in this proprietary analytics environment.
I also put a link to our summary of the current state of alternatives to Google Analytics blog post. There are other things out there that you can migrate to if you don’t like Plausible. We’ve landed on Plausible because we feel like it’s in the best shape of all the alternatives right now. Price wise and features wise, it’s just really usable. There’s not a clear answer to this. It’s definitely difficult and I really encourage folks to, like Miriam, I think that was your question like, if you want to have both on your site and to see how it feels and see how the landscape evolves, that’s great. Anything that will potentially allow you to break free of Google in the future should you choose to do so is a smart thing to do.
Steven: If anybody wanted to do that it would just be signing up for the account. You get the the month trial for free and then it would take an hour or so for us to install the module on your site.
It might take a little bit longer for us to do the import of your old Google Analytics data if we need to coordinate on getting access to your account sometimes that can be a little bit difficult if an organization has lost access to their account. It could be in some of these old email address or something. We’ve had some difficulties there but if you’re trying to just keep in mind budget and time in terms of how much work we have to do it’s just installing a Drupal module and then coordinating with you getting access to your Google Analytics account for importing. So we’re talking like an hour or two typically.
Then from there if you decide that this is something you want to keep, you would pay either the annual fee or the recurring monthly fee with Plausible for nine dollars a month.
Johanna: I see Sandra asked about,
How does social media fit with Plausible? I see that Facebook came up as a source. Are there other ways to integrate it?
Clayton: The other way that you can integrate it a little bit more is through these UTM tags. That’s the kind of thing where you’ll, yeah again the specifics I get a little fuzzy on, so maybe someone else can pipe in, but when you see a URL oftentimes you’ll see the URL to a page plus question mark plus UTM equals something something and that’s a way to basically tag this link as coming from a specific newsletter or coming from a specific platform and so those those get tracked in Plausible as well, so you can get a little bit more specific snapshot of
where people are coming from to get to your site.
I can’t think of anything else from a social media integration standpoint beyond that that Plausible does but I think that covers it.
Sandra: Thank you, yeah.
Johanna: At the end of the day really just asking yourself what do we want to track? And what’s most important because it can be really overwhelming and feel like oh like we’re not tracking as many things. Well a lot of that is noise. In most small to medium-sized non-profits or even larger nonprofits to be honest with you, there are certain things that you’re tracking as an organization that you need to track and too much extra stuff is noise. It’s for Enterprise level, enormous organizations.
That’s what Google Analytics is built for, with giant silos who crunch numbers for a corporation. If you don’t need that and if you’re not sure again running both gives you an exit ramp should you choose to ever take it. Also you could just use Plausible for a while and be like, am I getting what I need? If you are, technically speaking, is there going to be a performance hit if you have two analytics’ JavaScript running? In modern browsers not really. Probably like a tenth of a tenth of a tenth of a millisecond.
Steven: Plausible is a very lean JavaScript. It’s very very small, especially compared to Google’s.
Johanna: It’s more if you’re running both you’re also running Google and in fact you’re going to save weight on your site and you’re going to improve performance by getting rid of Google more than Plausible.
If you’re running both I don’t think a human being is going to notice that as a performance problem.
Clayton: I did want to point out, here’s what I mentioned as a limitation of the imported data. When you start clicking through and and getting into specific filters like this you know this like Drupal newsletter, it can’t pick up on that from the old Google Analytics sites. Some of that filtering isn’t going to be able to apply to your legacy data.
Steven: It’s more just the the raw numbers.
Clayton: Any other questions from anyone?
Johanna: I think we answered everything in the chat.
Sandra:
Could you show us a report again just on how you got it and just like a month.
Clayton: Sure yeah. I can filter by the time frame so if I wanted to see the last 30 days then I would come here.
If you wanted to see it by week instead of days then you can change it that way so that’s how you would get that report. As far as if you wanted something more downloadable then you would click this download icon right next to the time format and that would download a zip file of, well I could even show that.
Here’s the export. So it’s all of these different CSV files. So like visitors I feel like is one of the most helpful files and I’d open that up in Google Sheets or LibreOffice or Excel and then you can then do with it whatever you want to do.
Steven: Are you showing something?
Clayton: Oh I am. Oh here, let me re-share my screen. Sorry.
There it is. This is the zipped file.
This is the unzipped file. So this is the folder of all of the CSV files that you have. So if you want to be like I just want to see the info about operating systems here it is.
It’s okay. It’s not great.
Johanna: Michaela has a question.
Could you elaborate a bit more on what kind of filters won’t work for our Legacy data? By which they mean that info imported from Google Analytics.
Clayton: That this is something that I think we’re still trying to get more familiar with but if I was to filter by all of the source traffic it’ll give you a little icon here. It says stats do not include data imported from Google Analytics. So filtering by the source. I think it’s probably all of those actually. Yeah, if I filter by the country, really any of the filtering.
What am I trying to say? The facets of of show me visitors from this country, just show me visitors from Google, just show me visitors from this, from Mac OS,
It’s going to pull in the analytics that you like directly from Plausible.
The earlier you start using it the better I’d say but you can always go back to your Google Analytics dashboard with your legacy Google Analytics and create reports from your old data that way.
Johanna: That gets frozen in amber I believe, except that you can click on it, unlike amber. Quick question before anyone else hops off does anyone object to us sharing this whole recording publicly including your questions?
You’re welcome to message me back channel if so but your questions were really good so I’m thinking of including as much as we can.
Any other questions?
We’re going to follow up with that question involving what happens at a pricing threshold and see if someone from Plausible can answer that.
Thank you so much everyone for coming. We are really excited that everyone’s really so interested in not Google. Olivia asks a very important question, so if anybody wants Plausible what should they do?
Clayton: Submitting a help desk ticket is a great first step for sure.
Johanna: Awesome, all right. Thanks everybody. Have a good one. Happy Wednesday.
Clayton: Thank you so much, bye.
Leave a comment